
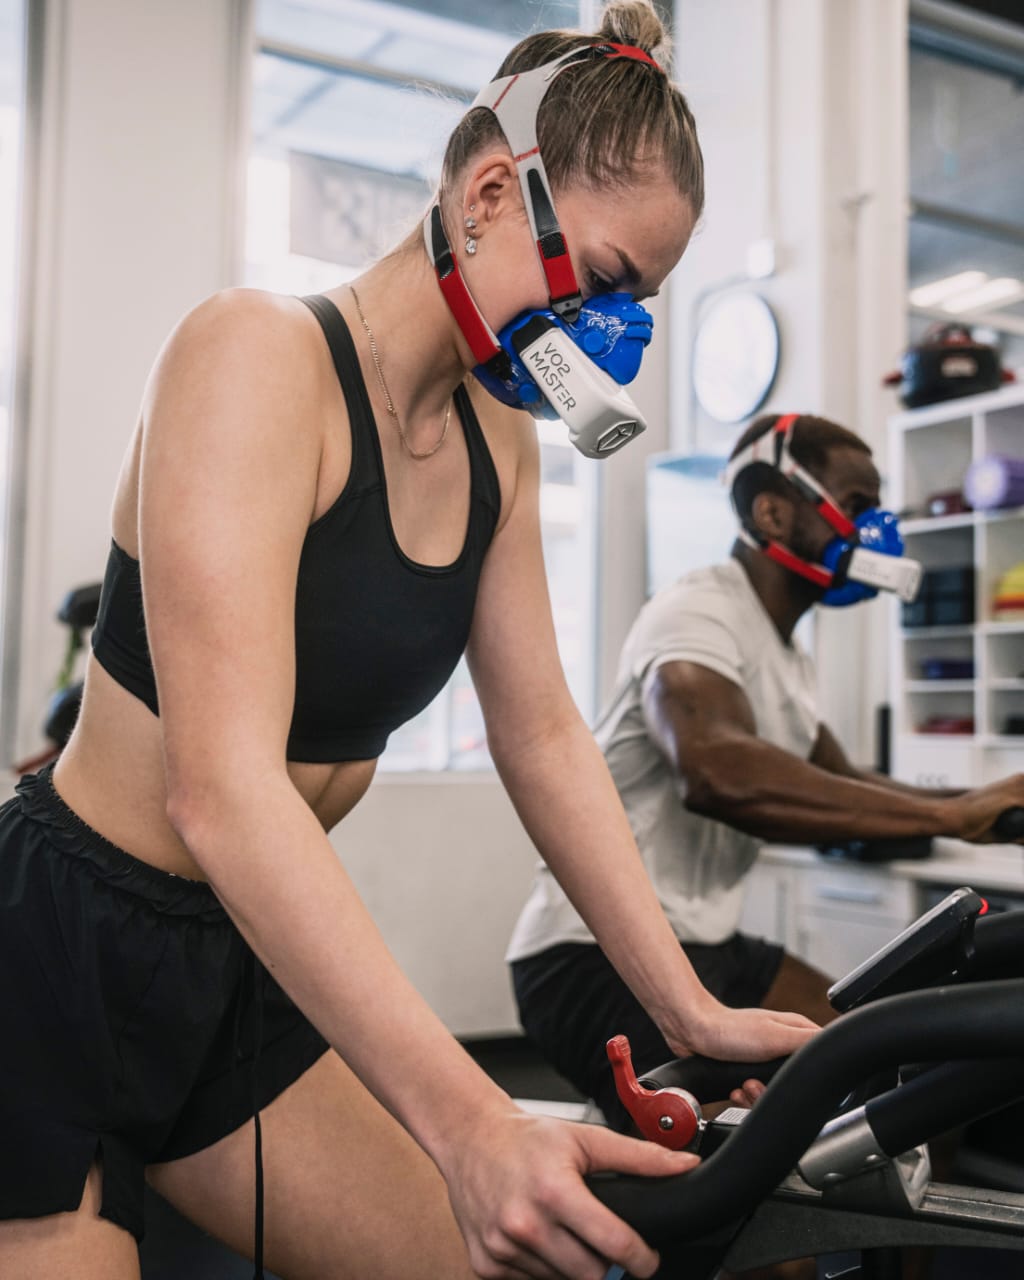
HRV baseline explained: how wearables turn RMSSD into a recovery score, why your number moves every day, and how to read it without guessing.
Table of Contents
- Key Takeaways
- What HRV and RMSSD Actually Measure
- Why Wearables Read HRV While You Sleep
- How an HRV Baseline Is Calculated
- What a Healthy HRV Range Looks Like
- Why Your Number Changes From Day to Day
- How to Build and Read Your Own HRV Baseline
- Limits and When to See a Doctor
- The Gap in the Evidence
- Frequently Asked Questions
- References and Sources
Key Takeaways
- HRV is the natural change in the time between your heartbeats. Most wearables report it as RMSSD, a number in milliseconds.
- Healthy adults vary a lot. A large review found an average RMSSD of 42 ms with a normal range of 19 to 75 ms, so your number only means something next to your own history.
- Your HRV baseline is your usual level, built from recent nights. Research uses a 7 day rolling average because single nights are noisy.
- WHOOP does not publish the exact weights in its recovery score, and its own data science team admits that one extreme night can skew your averages for weeks.
- Do not compare numbers across brands. Apple Watch has reported a different measure (SDNN) from Oura, Garmin, and WHOOP (RMSSD).
- Act on the trend over several days, not on one night.
Why Your HRV Number Means Almost Nothing on Its Own
A friend posts an HRV of 85 and you see 38 on your own wrist. Does that mean they are fitter or healthier? Probably not. A review of short term HRV studies, reproduced in a 2017 paper in Frontiers in Public Health, found an average RMSSD of 42 ms in healthy adults, with a range from 19 to 75 ms across 15 studies. Two perfectly healthy people can sit at opposite ends of that range.
That is why every major wearable compares you with yourself. The comparison point is your HRV baseline, and the way each device builds it decides whether your recovery score is useful or misleading. This guide explains how that baseline works and how you can read it with confidence.
What HRV and RMSSD Actually Measure
Your heart does not beat like a metronome. The time between one beat and the next changes by tiny amounts, and heart rate variability (HRV) is the size of those changes. A healthy heart reacts to breathing, stress, and rest by speeding up and slowing down slightly from beat to beat.
RMSSD is the most common way to put a number on it. The name stands for root mean square of successive differences. Here is a simple example using four gaps between heartbeats, in milliseconds: 1000, 1040, 980, and 1030.
- Find the difference between each neighboring pair: 40, minus 60, and 50.
- Square each one: 1600, 3600, and 2500.
- Average them: 7700 divided by 3 is about 2567.
- Take the square root: about 51 ms.
That 51 ms is your RMSSD for those four beats. Researchers treat it as a window into the vagus nerve, the nerve that slows your heart and helps you rest and recover. Plews and colleagues describe RMSSD as a vagally derived index of HRV, which is why it became the favorite measure for tracking training and recovery.
Why Wearables Read HRV While You Sleep
Daytime HRV is messy. Talking, walking, coffee, and your mood all push it around. Sleep removes most of that noise, so every major wearable takes its main reading at night.
The details differ by brand. WHOOP says slow wave sleep, the deepest stage, gives the most stable comparison from one night to the next. WHOOP’s head of data science has also explained that the company does not use a single reading. It calculates HRV in overlapping 5 minute windows, stepping forward every 30 seconds through the whole night. Windows from likely slow wave sleep and from later in the night count for more, because later periods tend to better reflect overnight recovery. Oura, Garmin, and Fitbit report RMSSD too, and one industry review says most of them average several 5 minute recordings from the same night.
The measurements hold up better than many people expect. A 2022 study in JMIR compared the Oura Ring with a medical grade chest ECG in 35 healthy people and found that the ring measured nighttime heart rate and RMSSD accurately, both in 5 minute segments and as a nightly average. An earlier study by Oura’s own scientists found very high agreement for RMSSD too, but it included only healthy people with RMSSD between 20 and 100 ms. Outside that group, such as people with irregular heartbeats, the ring was not tested.
How an HRV Baseline Is Calculated
Your baseline is your usual HRV, worked out from your recent nights. The method most wearables borrow comes from sports science, and it has three parts.
Part 1: Average Several Nights
Daily numbers jump around, so researchers average them. Daniel Plews and colleagues in New Zealand used a 7 day rolling average of RMSSD, which means each day’s value is the mean of the last seven nights. A Finnish training study found that this rolling average gave a more reliable picture of how athletes responded to training than a single morning value, which has more day to day swing.
You do not need a reading every night. In a 2014 paper in the International Journal of Sports Physiology and Performance, Plews’s group concluded that at least three valid readings per week is the minimum for judging training adaptation in trained athletes.
Part 2: Use a Log Scale
Researchers usually take the natural log of RMSSD, written Ln rMSSD. This makes the numbers behave more evenly, so a jump from 30 to 40 and a jump from 60 to 80 look like the equal proportional changes that they are. You will rarely see the log value in an app, but some platforms use it behind the scenes.
Part 3: Compare With a Personal Normal Band
Plews compared the rolling average with an individual smallest worthwhile change, a band built from that person’s own variation. Inside the band, you are normal for you. Outside it, something has probably changed.
Here is a simple version you can try. Suppose your last seven nights read 48, 52, 45, 50, 41, 49, and 47 ms. The average is about 47 ms. Tonight you read 38 ms, which is about 20 percent below your average. One night like that is a nudge, not a verdict. Three or four nights in a row at that level is a trend worth noticing.
What Recovery Scores Add
A recovery score takes your HRV baseline and adds other signals. WHOOP’s leadership has said that its Recovery score is driven mainly by HRV, then read alongside resting heart rate, with a smaller contribution from sleep. The company does not publish the exact weights or the length of the baseline window, so you cannot rebuild the score yourself.
WHOOP’s data science lead has also admitted a weak spot. Extremely high HRV readings that are unusual for a member are often not a sign of better recovery. They can give an overly green score that day and then throw off the averages for weeks afterward. The lesson is simple. A very high night is not a prize to chase, and it can distort the baseline that every later score is judged against.
What a Healthy HRV Range Looks Like
Published norms exist, but they have limits. The 2017 Frontiers review cites a short term norm of 42 ms for RMSSD, with a standard deviation of 15 and a range of 19 to 75 ms. The authors warn that 24 hour, short term, and ultra short term values are not interchangeable. A number from a 5 minute lab test, an all night average, and a wearable’s nightly figure each answer a slightly different question.
Brand matters too. Oura, Garmin, Fitbit, and WHOOP report RMSSD, while Apple Watch has reported SDNN, a broader measure of total variability. The two are not directly comparable. The practical rules are easy: compare yourself only with your own history on one device, and if you switch devices, treat the first two weeks as a new baseline.
Why Your Number Changes From Day to Day
Poor sleep, hard training, stress, illness, alcohol, and a late meal can all pull your HRV down. A rest day or an easy week can push it up. None of these effects needs a medical explanation, and most settle within a few days.
Plews and colleagues also studied how HRV behaves in the weeks before an athlete becomes overreached, meaning too tired to adapt. In a 2012 case study of two elite triathletes over 77 days, the 7 day average fell steadily in the athlete who went on to overreach. The same athlete’s day to day variation also shrank, while both measures stayed steady in the control athlete. With only two people, this is a clue and not a rule. It does suggest that a flat, very stable HRV is not always a good sign in someone training hard.
How to Build and Read Your Own HRV Baseline
- Wear your device every night for about two weeks with your normal routine. Two weeks is a practical starting point, not a rule from the studies.
- Ignore single nights. Look at your 7 day average instead.
- Note your normal band, which is the lowest and highest 7 day averages you see when life is ordinary.
- Check whether your 7 day average has moved outside that band for several days, and whether your resting heart rate is up or you feel run down.
- Change your plan only when the trend and how you feel agree. An easy day is a small price for being wrong.
Do not chase a higher number for its own sake. WHOOP’s own materials stress that higher HRV only has meaning compared with your own baseline, and not as a universal target.
Limits and When to See a Doctor
A wearable HRV score is a wellness estimate. It is not a diagnosis, and a low reading alone does not mean you are sick. See a doctor if you have chest pain, fainting, a racing or very irregular heartbeat, or shortness of breath, whatever your app says. If your numbers stay far outside your usual band for weeks without a clear reason, bring your data to a clinician.
The Gap in the Evidence
Studies show that wearables can measure nighttime RMSSD well in healthy people. No independent study has shown how Oura, Garmin, and WHOOP turn that number into a score, because each company keeps its weights and baseline windows private. Until those details are open to testing, treat each recovery score as one company’s opinion about your HRV baseline, and trust your own multi week trend more.
Frequently Asked Questions
What is a good HRV?
It depends on you. A review of short term studies found an average RMSSD of 42 ms and a range of 19 to 75 ms in healthy adults. The useful question is whether your number is normal for you.
Is a higher HRV always better?
No. Higher HRV is generally linked to good recovery when it fits your own pattern. A sudden, unusually high reading can be a sign of something else, and WHOOP’s data science team has said such spikes can skew recovery scores.
What is the difference between RMSSD and SDNN?
RMSSD focuses on beat to beat changes and is the favorite for daily recovery tracking. SDNN measures total variability across a longer period. Apple Watch has reported SDNN, so its numbers should not be compared with RMSSD from other brands.
How long does it take to build an HRV baseline?
Research uses a 7 day rolling average, and Plews’s group suggests at least three valid readings a week. About two weeks of nightly wear is a sensible starting point for most people.
Why does my HRV drop?
Common causes are poor sleep, hard training, stress, alcohol, and illness. One low night is normal. A drop that lasts several days and comes with a higher resting heart rate is worth acting on.
Can I compare my HRV with a friend’s?
Not in a useful way. Healthy adults vary widely, and different brands measure and average HRV in different ways.
References and Sources
- Shaffer F, Ginsberg JP. An Overview of Heart Rate Variability Metrics and Norms. Frontiers in Public Health, 2017. https://pmc.ncbi.nlm.nih.gov/articles/PMC5624990/
- Nunan short term HRV norms, Table 6. Reproduced in Shaffer and Ginsberg, 2017. https://pmc.ncbi.nlm.nih.gov/articles/PMC5624990/table/T6
- Plews DJ, Laursen PB, et al. Heart rate variability in elite triathletes, is variation in variability the key to effective training? A case comparison. European Journal of Applied Physiology, 2012. https://pubmed.ncbi.nlm.nih.gov/22367011/
- Plews D, et al. Monitoring training with heart rate variability: how much compliance is needed for valid assessment? International Journal of Sports Physiology and Performance, 2014. http://doi.org/10.1123/IJSPP.2013-0455
- Plews D. The Practical Application of Heart Rate Variability, Monitoring Training Adaptation in World Class Athletes. Doctoral thesis, Auckland University of Technology. https://openrepository.aut.ac.nz/items/d7b41d29-e92e-4acf-90ea-ed68d84d6c73
- Individual adaptation to endurance training guided by heart rate variability. University of Jyvaskyla. https://jyx.jyu.fi/handle/123456789/45036
- WHOOP Community, HRV extreme spikes, reply from WHOOP data science lead. https://community.whoop.com/t/hrv-extreme-spikes/6472/31
- WHOOP, Podcast 194: Understanding Heart Rate Variability and Its Performance Potential. https://www.whoop.com/ie/en/thelocker/podcast-194-understanding-heart-rate-variability-and-its-performance-potential/
- Accuracy Assessment of Oura Ring Nocturnal Heart Rate and Heart Rate Variability in Comparison With Electrocardiography in Time and Frequency Domains: Comprehensive Analysis. JMIR, 2022. https://www.jmir.org/2022/1/e27487/
- Kinnunen H, Koskimaki H. The HRV of the Ring: Comparison of nocturnal HR and HRV between the Oura ring and ECG. https://ouraring.com/blog/wp-content/uploads/2018/10/The-HRV-of-the-Ring-Comparison-of-OURA-Ring-to-ECG.pdf
- Terra. How HRV Actually Works: device and metric differences across wearables. https://www.tryterra.co/research/how-hrv-actually-works
- Wearable Beat. How Does WHOOP Work: Sensors, Recovery Scores, and Strain Explained. https://wearablebeat.com/articles/how-does-whoop-work-sensors-recovery-scores-and-strain-explained/
ABOUT THE AUTHOR
ABIODUN EMMANUEL
SEO content writer focused on creating clear, persuasive, and engaging content that educates and drives results.
About The Author


