
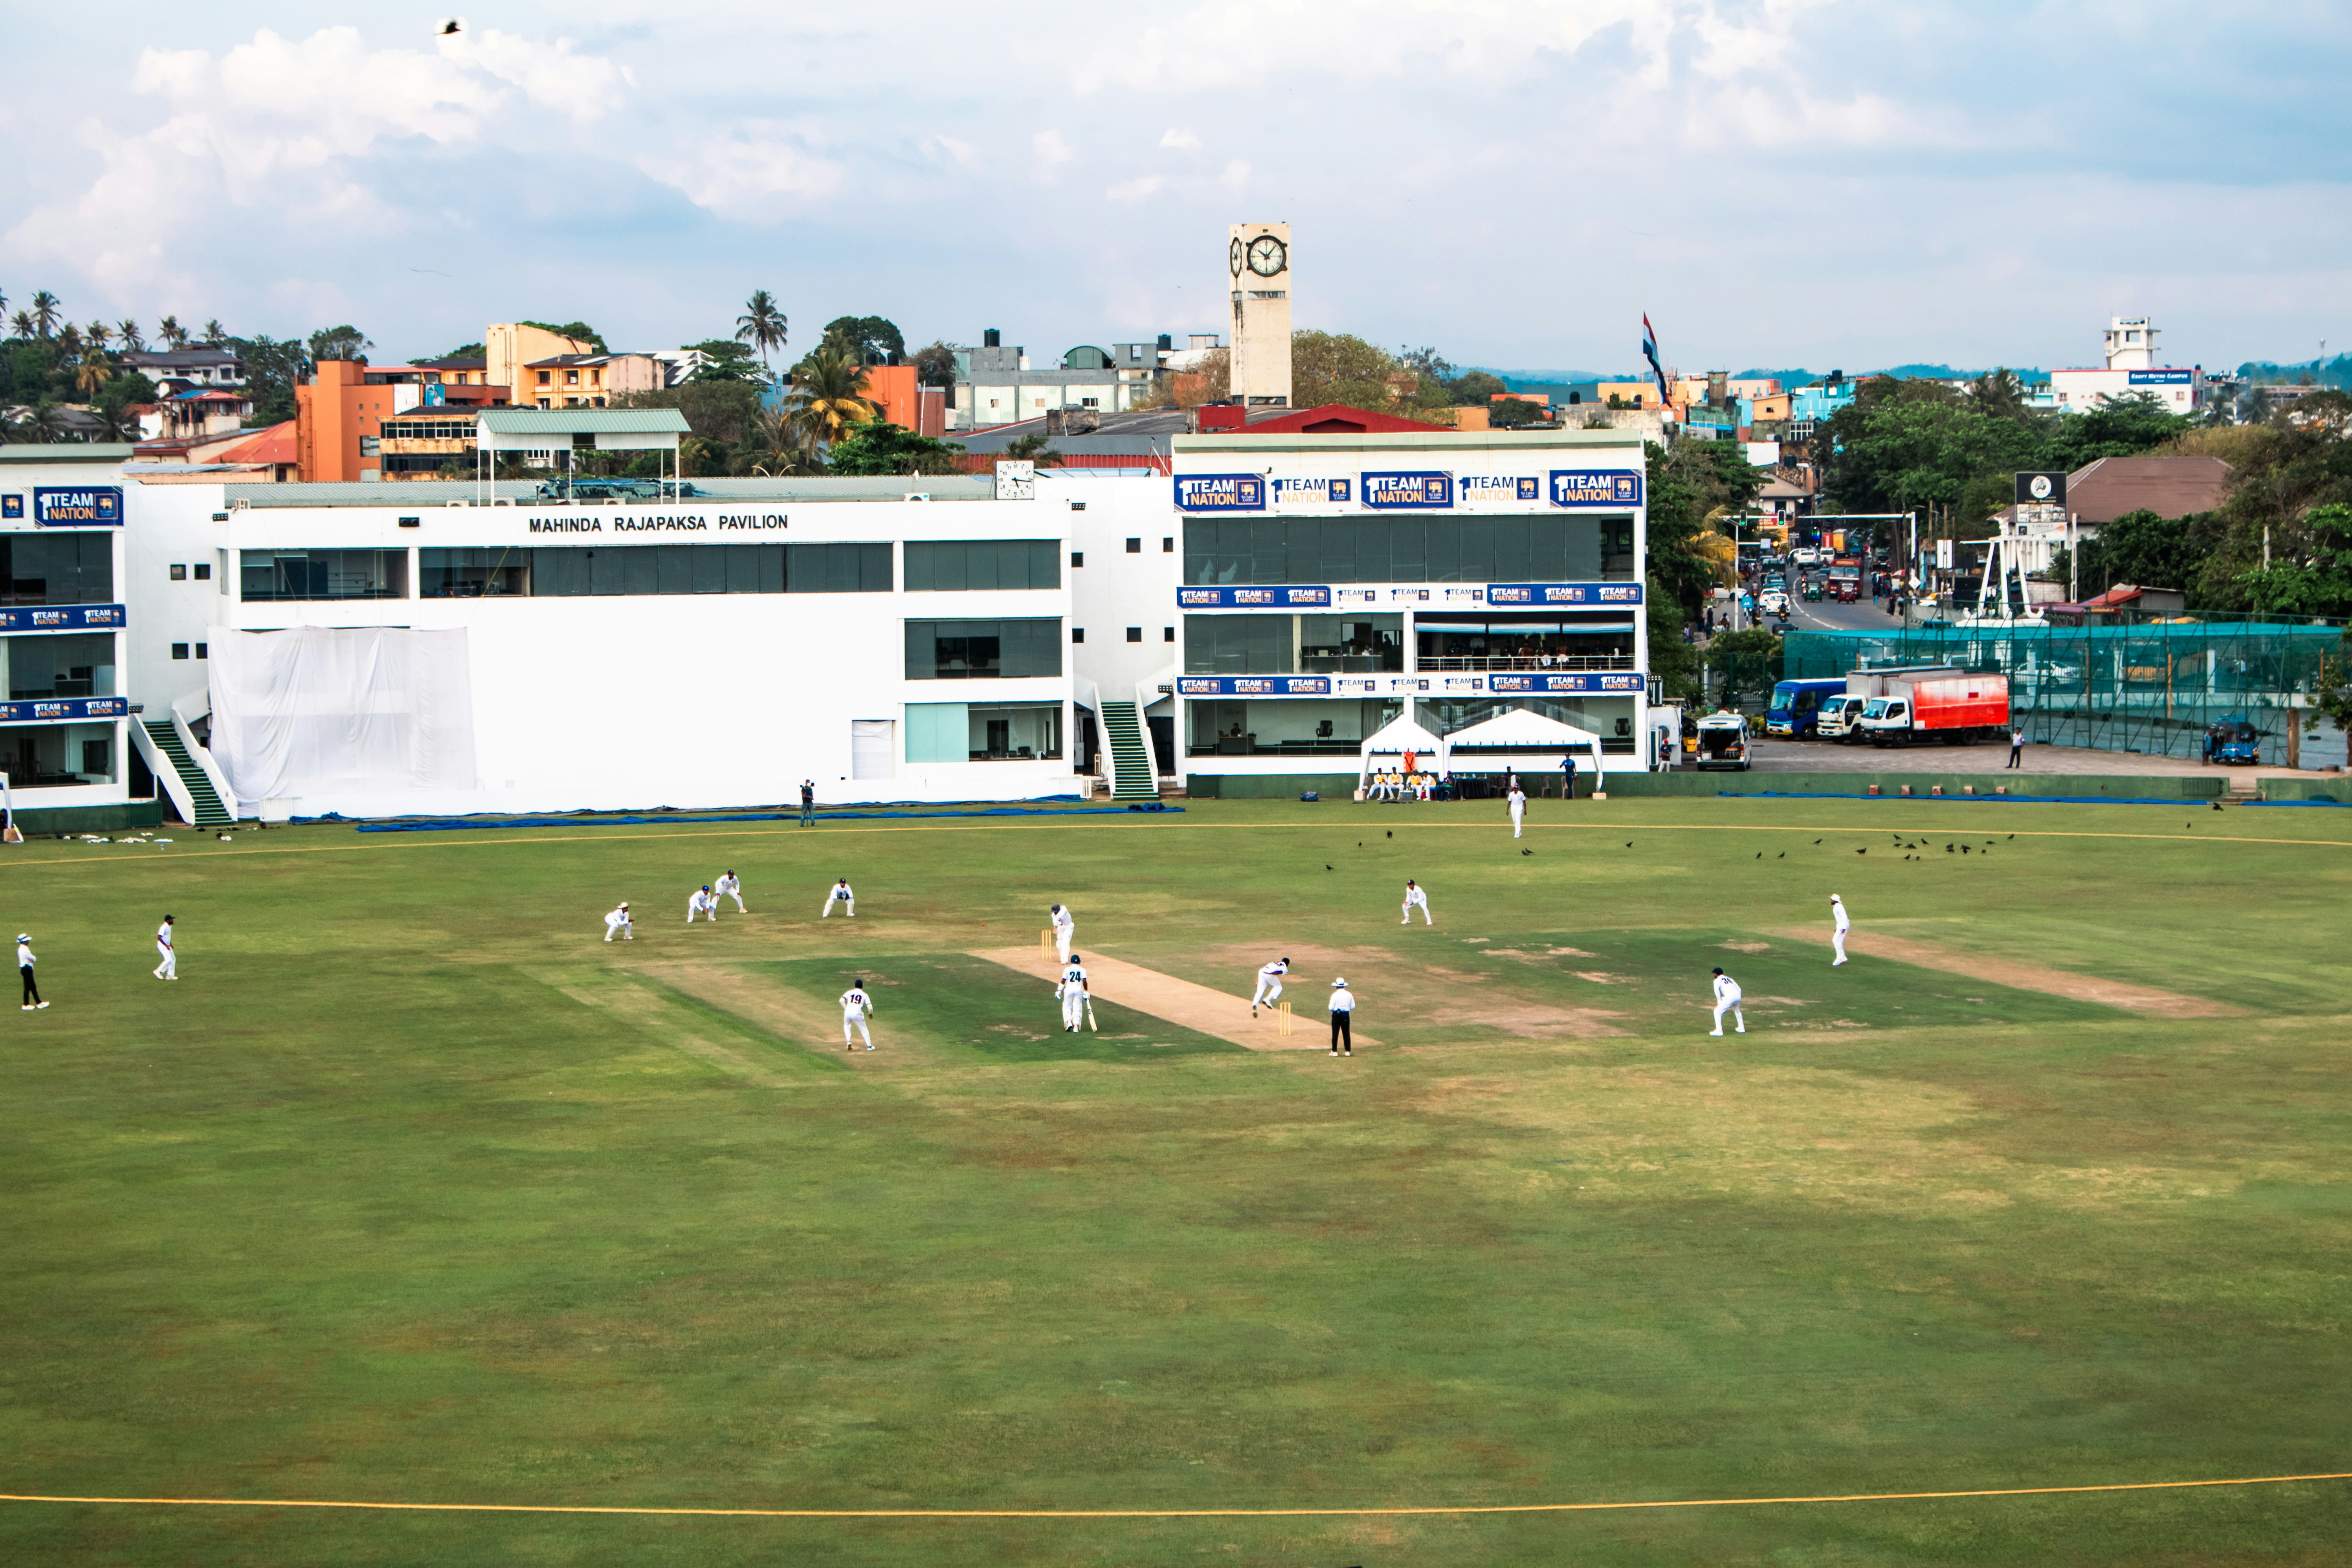
Modern cricket thrives on packed calendars, cross-border leagues, and non-stop media coverage. Every additional match expands revenue and fan engagement, yet fatigue and logistical clashes can derail even the strongest tournament brand. Smart cricket match scheduling balances commercial imperatives with player welfare, broadcast windows, and global viewership patterns. When designed with data, scheduling raises competitive quality, maximizes stadium occupancy, and drives digital consumption. This article explains the mechanics of advanced scheduling, shares industry benchmarks, and presents actionable strategies for boards, franchises, and event operators.
Evolution of Cricket Calendars
Cricket schedules once revolved around bilateral Test tours lasting several months. The emergence of limited-overs internationals, franchise T20 leagues, and women’s competitions stretched the calendar. The International Cricket Council (ICC) now coordinates more than 2,000 fixtures annually across formats. Statista data shows global cricket broadcast hours grew by 38 percent between 2015 and 2024 . Each hour demands meticulous planning to prevent overlaps that dilute ratings and strain player workloads.
Core Objectives of Smart Scheduling
- Maximize competitive fairness: Equal rest periods for teams ensure consistent performance.
- Optimize broadcast reach: Slot marquee games during prime local and secondary markets.
- Reduce travel fatigue: Cluster fixtures geographically to limit cross-time-zone flights.
- Protect player health: Respect workload caps and mandatory recovery windows.
- Boost stadium revenue: Avoid weekday afternoon matches when attendance drops.
Data Inputs for Schedule Design
Historical Attendance Patterns
Stadium entry figures reveal days and times that drive higher gate revenue. For example, Melbourne Cricket Ground records a 22 percent attendance uplift for Saturday night Big Bash matches over mid-week slots (Cricket Australia gate data, 2024).
Broadcast Ratings and Digital Streams
Networks provide minute-by-minute viewership data. Analysts map peaks against ball-by-ball logs to identify attractive matchups and ideal first-ball timings.
Player Workload Metrics
- Bowling overs per week
- Minutes batted per innings
- GPS-tracked distance covered in field
Boards combine these with injury surveillance dashboards to set rest windows.
Meteorological and Venue Data
Rain probability, day-night temperature swings, and pitch preparation timelines inform match sequencing.

Scheduling Algorithms and Tools
Constraint Programming
Software applies mandatory rules—venue availability, rest minimums—then searches for feasible fixture lists. The England and Wales Cricket Board uses a constraint engine that reduced manual schedule iterations by 70 percent for the 2024 domestic season.
Optimization Heuristics
Genetic algorithms rank candidate schedules by weighted objectives: TV priorities, fan travel convenience, and equitable rest. The Indian Premier League adopted a heuristic model that cut average team travel distance to 10,200 km in 2025 from 14,600 km in 2023 (BCCI logistics report).
Machine Learning Forecasts
Predictive models assess rain risk and expected viewership to recommend slot changes months ahead.
Case Study: ICC Men’s T20 World Cup 2024
Goals:
- Minimize group-stage overlaps to boost ratings.
- Provide 48-hour rest after cross-continental flights.
- Schedule high-profile rivalries on weekends.
Outcomes:
- Global TV reach jumped 18 percent compared to 2022.
- Injury-related withdrawals fell by 12 percent.
- Three venue clusters reduced average team flight time by 26 percent.
Strategies for Domestic Leagues
Geographic Clustering
Schedule consecutive away games within one region. Teams in The Hundred played two matches in Manchester before moving south, saving GBP 230,000 in charter costs.
Staggered Double-Headers
Back-to-back men’s and women’s fixtures share infrastructure while amplifying attendance. Big Bash League women’s matches saw a 34 percent uplift when paired with men’s games.
Fan Zone Time Blocks
Fix start times around public transport peaks and family routines: 7 p.m. local for urban venues or 4 p.m. Sundays for suburban grounds.
International Windows and League Overlaps
The growth of franchise leagues complicates national commitments. Smart scheduling requires:
- Dialogue among boards to allocate mandatory release periods.
- Player workload agreements limiting league seasons to eight weeks.
- Sequenced global windows: January for southern hemisphere leagues, April–May for IPL, August for The Hundred, leaving June–July for ICC events.
PwC projects lost broadcast revenue of USD 140 million in 2023 due to overlapping high-profile fixtures . Harmonized schedules safeguard media rights value.
Player Welfare Protocols
Sports science research links sub-four-day rest periods to elevated soft-tissue injuries. Best practice includes:
- Minimum 72 hours between T20 games.
- Cap of 170 overs per fast bowler across eight days.
- Mandatory recovery sessions and travel days protected from match duty.
The Australian Cricketers Association credits these limits for a 25 percent reduction in hamstring tears during 2024-25 domestic seasons.
Broadcast Collaboration
Networks influence first-ball times to capture peak markets. Schedule teams:
- Align blockbuster matches with Asian primetime when viewership spikes.
- Offer alternate replay slots in secondary markets.
- Provide flexible start provisions for rain-prone venues, allowing earlier kick-offs.
Collaboration ensures fan accessibility without sacrificing stadium atmosphere.
Technology Integration for Real-Time Adjustments
Cloud-based schedule dashboards integrate:
- Updated weather forecasts
- Injury bulletins
- Ticket sales pace
Managers can shift start times within defined buffers or swap venues when storms threaten. The Caribbean Premier League avoided two wash-outs in 2024 by moving matches 24 hours earlier, saving USD 900,000 in refund liabilities.
Financial Impact of Smart Scheduling
- Ticketing: Balanced weekday/weekend mix can lift total attendance 12–15 percent.
- Broadcast: Prime-time placements add up to 20 percent to ad slots.
- Sponsorship: Predictable marquee clashes attract premium partners.
Statista tracks a USD 1.8 billion global cricket broadcast market in 2025, a seven-percent rise year-over-year partly linked to efficient fixture alignment.
Challenges and Risk Factors
- Venue availability constrained by multi-sport use.
- Political or health disruptions forcing late relocations.
- Regional weather variability beyond historical norms.
Mitigation plans include multi-venue backup bookings and insurance coverage for abandoned matches.
Future Trends
- AI-driven schedule personalization allowing fans to receive local time notifications.
- Green scheduling optimizing daylight matches to cut stadium lighting emissions.
- Virtual reality pre-views helping boards test fan flow models before finalizing fixture lists.
Conclusion
Smart cricket match scheduling is a competitive advantage rooted in data, logistics, and long-term planning. It goes far beyond filling calendar slots—it shapes the rhythm and quality of the game. By using workload metrics, injury trends, and audience data, cricket boards can design fixtures that prioritize player longevity and maximize fan engagement. In 2025, leading organizations use AI-powered modeling to anticipate weather disruptions, manage travel demands, and stagger prime-time matches across global time zones. This attention to detail improves the fairness and commercial viability of tournaments.
Sources
https://www.icc-cricket.com
https://www.statista.com
https://www.pwc.com
https://www.ecb.co.uk
https://www.bcci.tv
About The Author


